
Meaning
It
Welcome to The Trust Times, our magazine about the science of building trust. Our previous issue covered three independent scientific studies about timing: pro-active communication is powerful for trust building. This issue focuses on how you're graded on trust when you communicate.
The first study is from the European Journal of Political Research. People in five countries were shown pairs of governments and asked which they would trust. The one that got things done lost to the one described as acting in its citizens' interests. Where a government wasn't seen as acting in people's interests, being capable counted against it.
The second, from the British Journal of Political Science. Americans surveyed days after a midterm election watched either a car commercial or a short clip of their own state’s election official walking through how ballots are counted. The clip raised trust in that state’s elections, for all audiences. A clip about elections in some other location had no impact.
The third gave Dutch readers one short article about garden paving, written two ways. One stopped at the findings. The other added the author saying what people should do, and that he had done it in his own garden. Readers rated him more attuned to what real people face.
Across all three of these studies, the key theme is peoples' belief about whose interest is being served.

Sources · Issue No. 8
About This Issue
Three peer-reviewed studies on how trust is built, retold in plain language. The “at your desk” sections are our editorial application, not claims made by the researchers.
Whose interest a client believes you are serving, and what it takes for them to believe it: the trait that outranked competence across five countries, the official who explained the machine they run, and the expert who said what he would do about it.
In our previous issue we covered three studies on what a client hears before they ask for it. Read the previous issue.
Acting in People’s Interests Beat Being Good at the Job
Nearly twelve thousand people in five countries chose which of two governments they would trust. The one that looked out for them won more often than the one that was competent, and competence with no goodwill behind it counted against the government that had it.
Devine, D., Valgarðsson, V., Jennings, W., Stoker, G., & Bunting, H. (2025). The causes of perceived government trustworthiness. European Journal of Political Research, 64(3), 1394-1412. doi:10.1111/1475-6765.12742
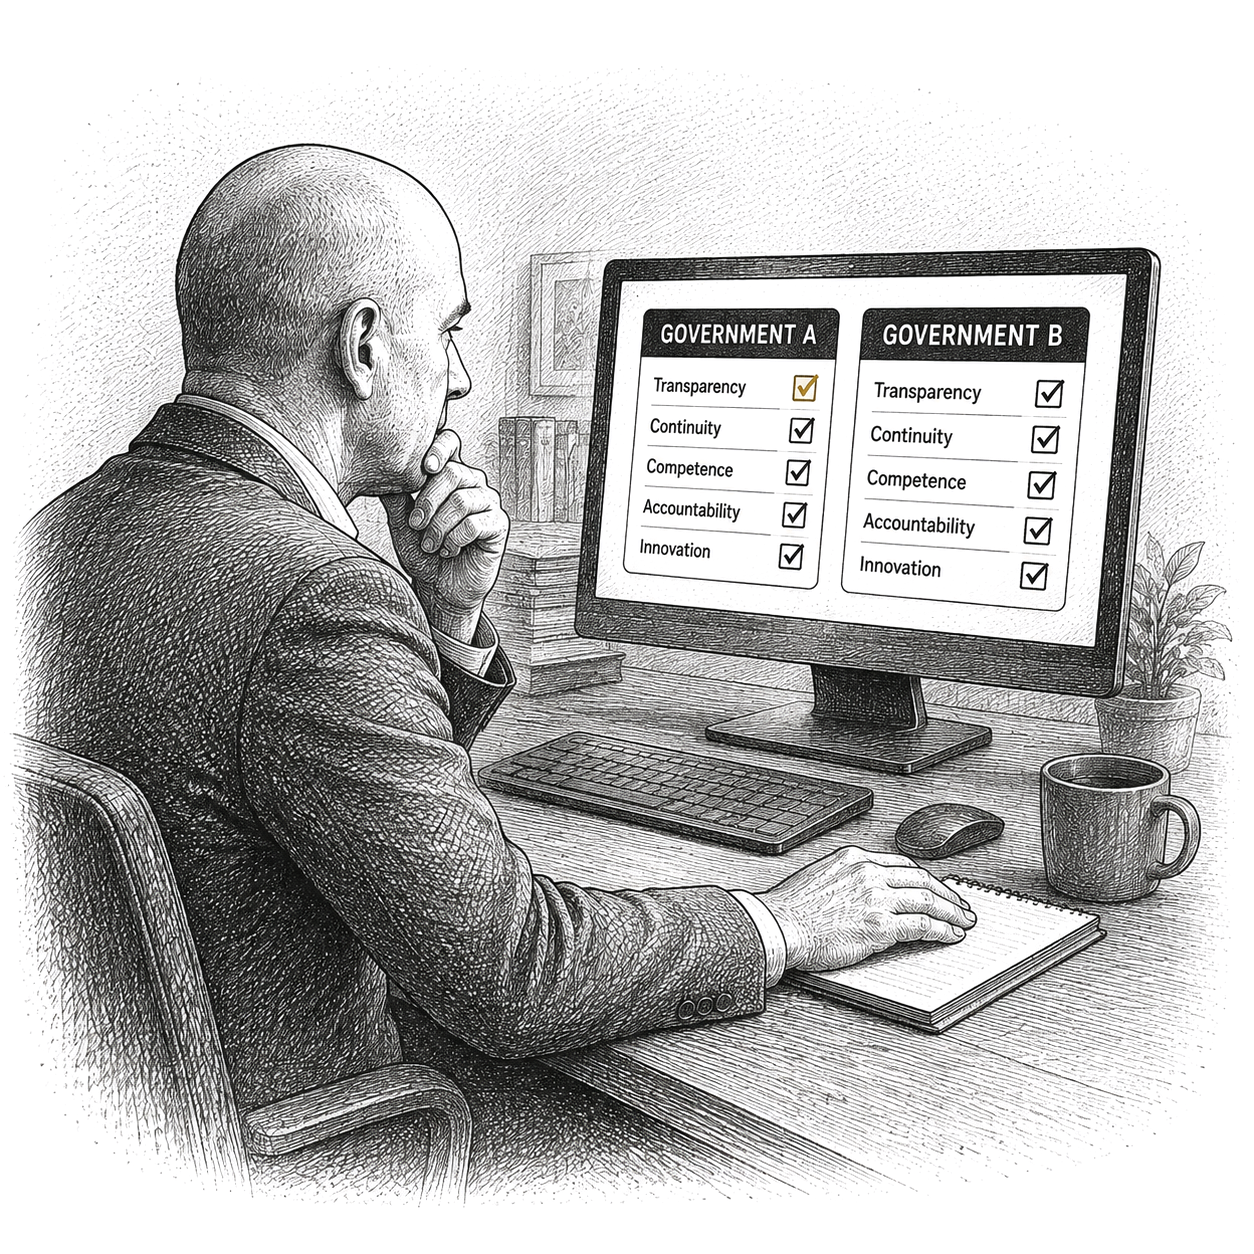
Two governments sit side by side on a screen. One of them manages the country's affairs well and delivers what it promises. The other does not, but it's described as acting in the interests of its citizens rather than its own. Pick the one you'd tend to trust more.
Respondents in five countries did exactly that, over and over, with the details of the descriptions reshuffled every time.
Daniel Devine and four colleagues built the exercise to settle an argument that has been running in political science since the 1970s. Everyone agrees that trust has causes. Nobody agrees which cause carries the most weight.
The experiment
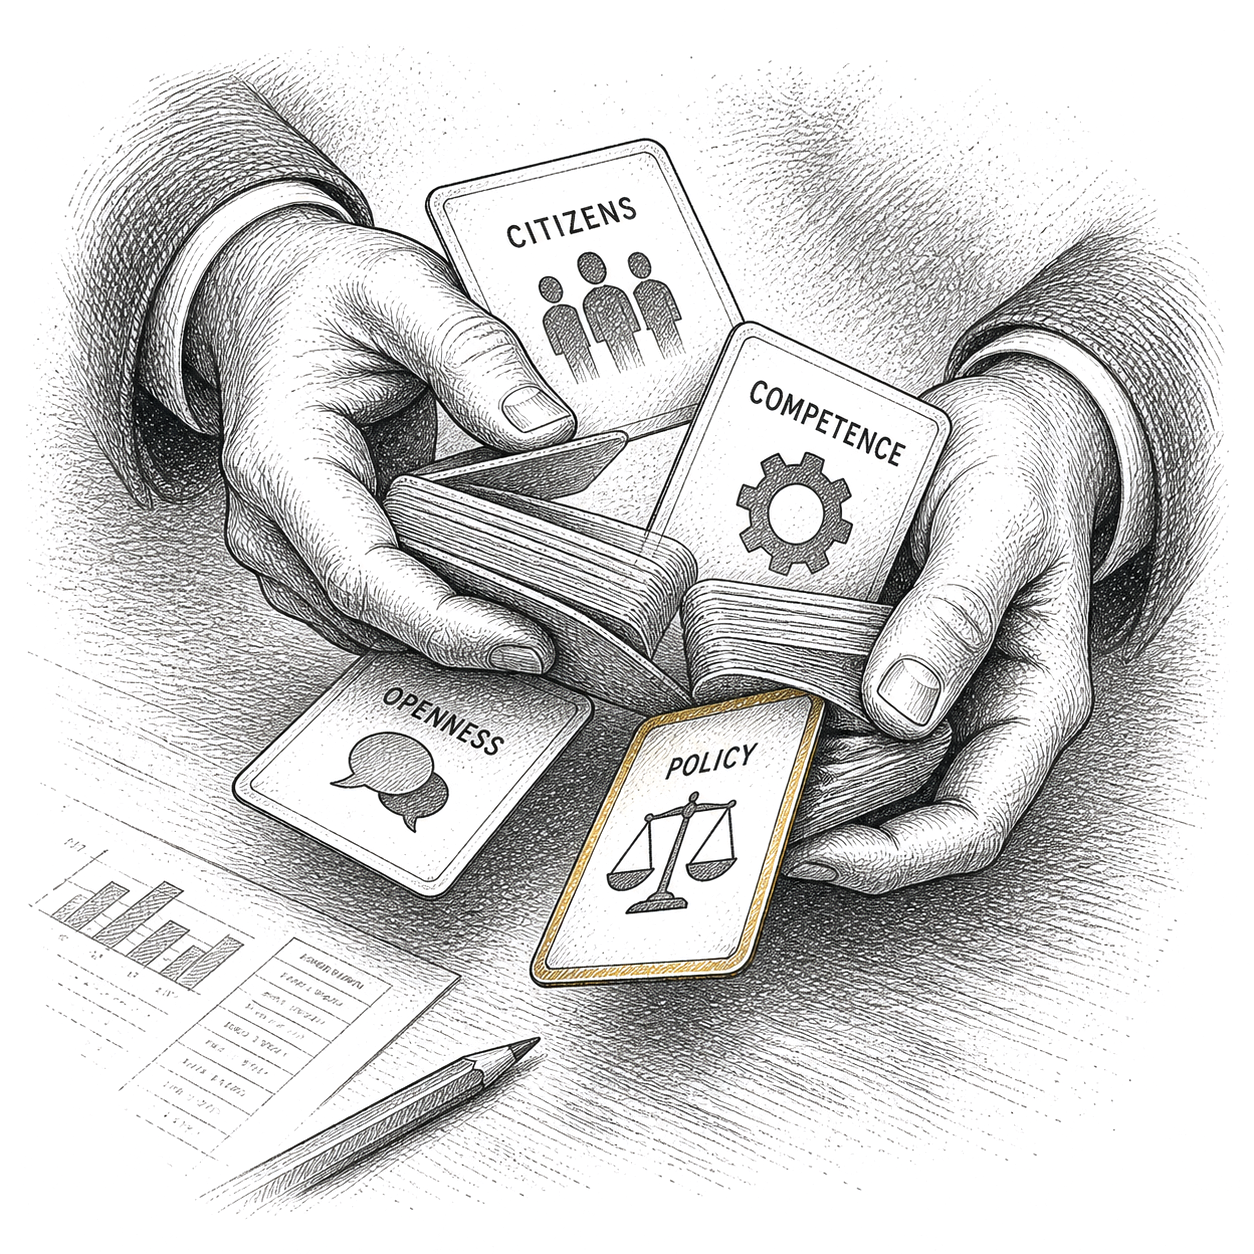
The design is called a conjoint, and the whole point of it is that every trait moves independently. Each respondent saw two profiles, labelled Government A and Government B. Each profile carried a level of competence, a level of benevolence, a level of integrity, and, so the choice would feel like a real one, a tenure, an ideology, a policy priority and an approval rating. All of it randomized. That independence is what makes the answer readable: a competent government in this deck was no more likely than an incompetent one to also be honest, so a preference for competence cannot be mistaken for a preference for something competence often arrives with.
The first version of the test ran inside the British Election Study in May 2020. The researchers then fielded a revised version in Croatia, Spain, Argentina and France between September and November 2021, on nationally representative samples. In total, 11,930 people made close to 30,000 comparisons.
What they found
In the four countries outside Britain, one attribute pulled away from the rest. Of two governments side by side, the one described as looking after its own interests was chosen 38 percent of the time. The one described as acting in the interests of its citizens was chosen 57 percent. Nineteen points.
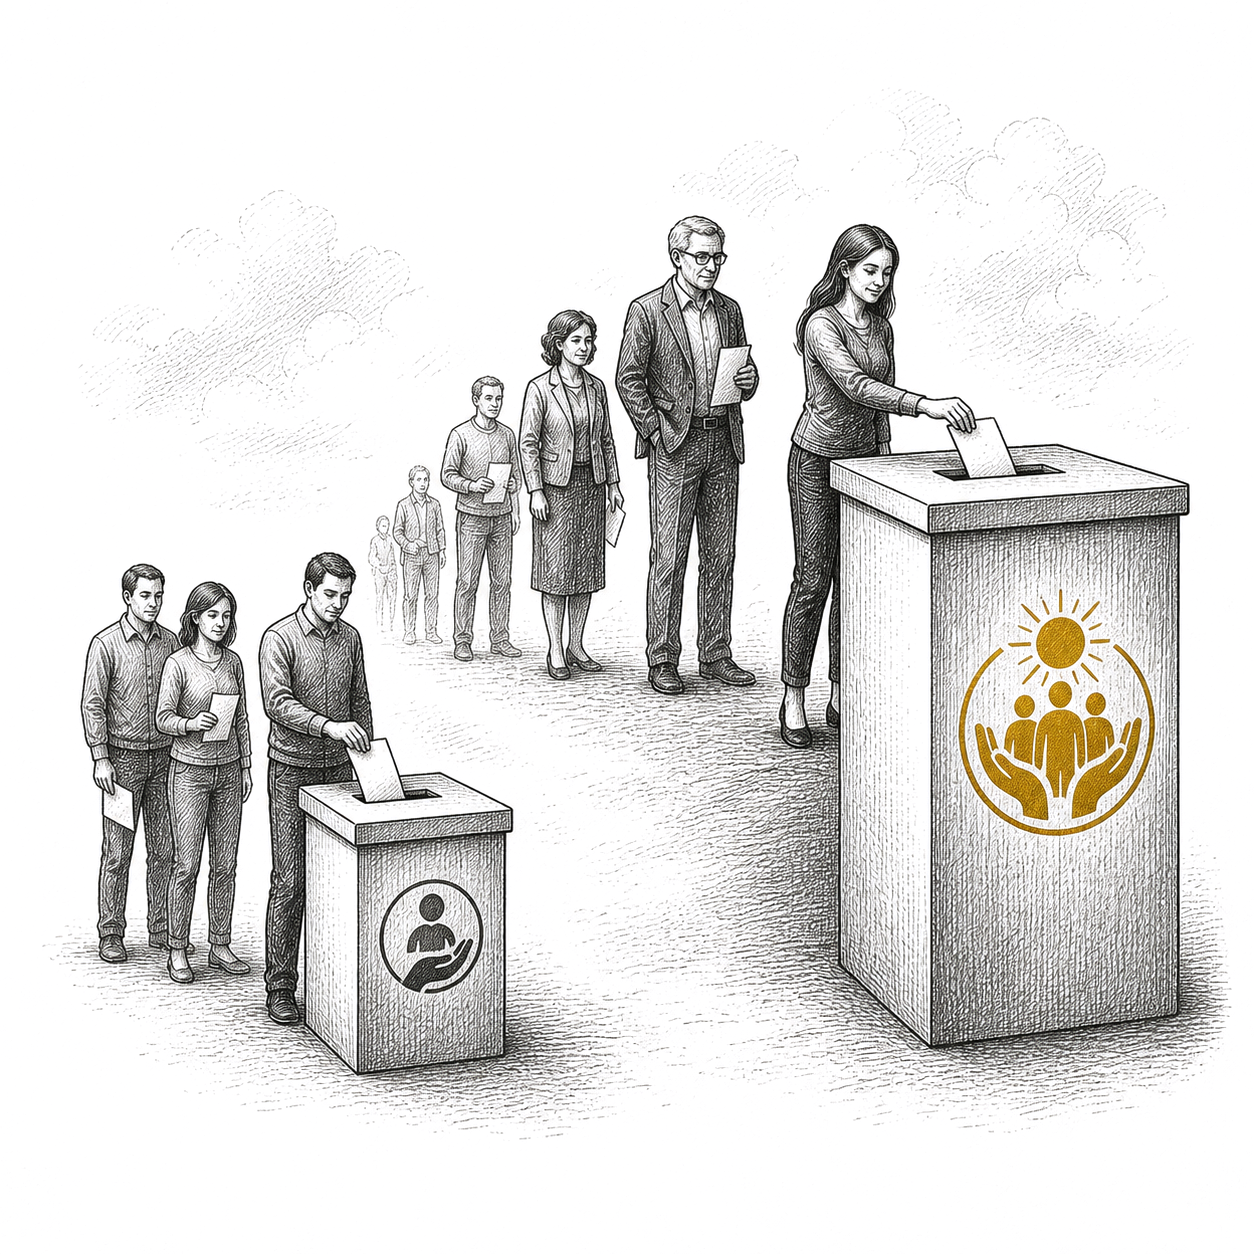
Competence moved the choice by 14 points, from 43 percent to 57. Being open and transparent moved it by 12, from 43 to 55. Both real, both secondary.
Skill still matters. But when people are handed every quality at once and made to choose, they reach for motive first.
The one thing that beat it
Britain is the exception, and the reason why is interesting. The British version included an attribute the others did not: whether the government was corrupt, or generally free of corruption. That one factor topped everything. A corrupt government was chosen 40 percent of the time. One free of corruption was chosen 64 percent of the time. Twenty-four points, the widest gap among the qualities the researchers set out to compare.
The researchers dropped corruption from the later surveys because they could not tell which quality it was measuring. Corruption might read as a failure of honesty, of goodwill, or even of competence. Whatever it is, it sits underneath the other three. Staying clean is the floor. Above the floor is where motive outruns skill.
Competence made it worse
The team then looked at how the attributes acted on each other, and turned up the result that is easiest to forget and most worth keeping. A government seen as competent, but not seen as acting in citizens’ interests, was trusted less than its separate parts would predict. Being good at the job counted against it.
The penalty was small. It also ran in the opposite direction from what a list of qualifications assumes. Capability is not a foundation that goodwill gets built on top of. It behaves more like a multiplier of whatever motive is underneath it. A government that is effective and not on your side is not a partial win. It is a more efficient problem.
The researchers also checked whether different sorts of people wanted different things. Education, employment and sex barely shifted the weights. Age mattered, but only for transparency. The one characteristic that mattered across the board was left-right ideology, and it mattered most for competence, which counted for less among respondents on the right.
What This Means at Your Desk
Answer the motive question before the capability question. A prospect is looking at both. Your credentials, your numbers, your process: those all come second. The first question is whose interest the advice serves, and it is almost always asked in silence.
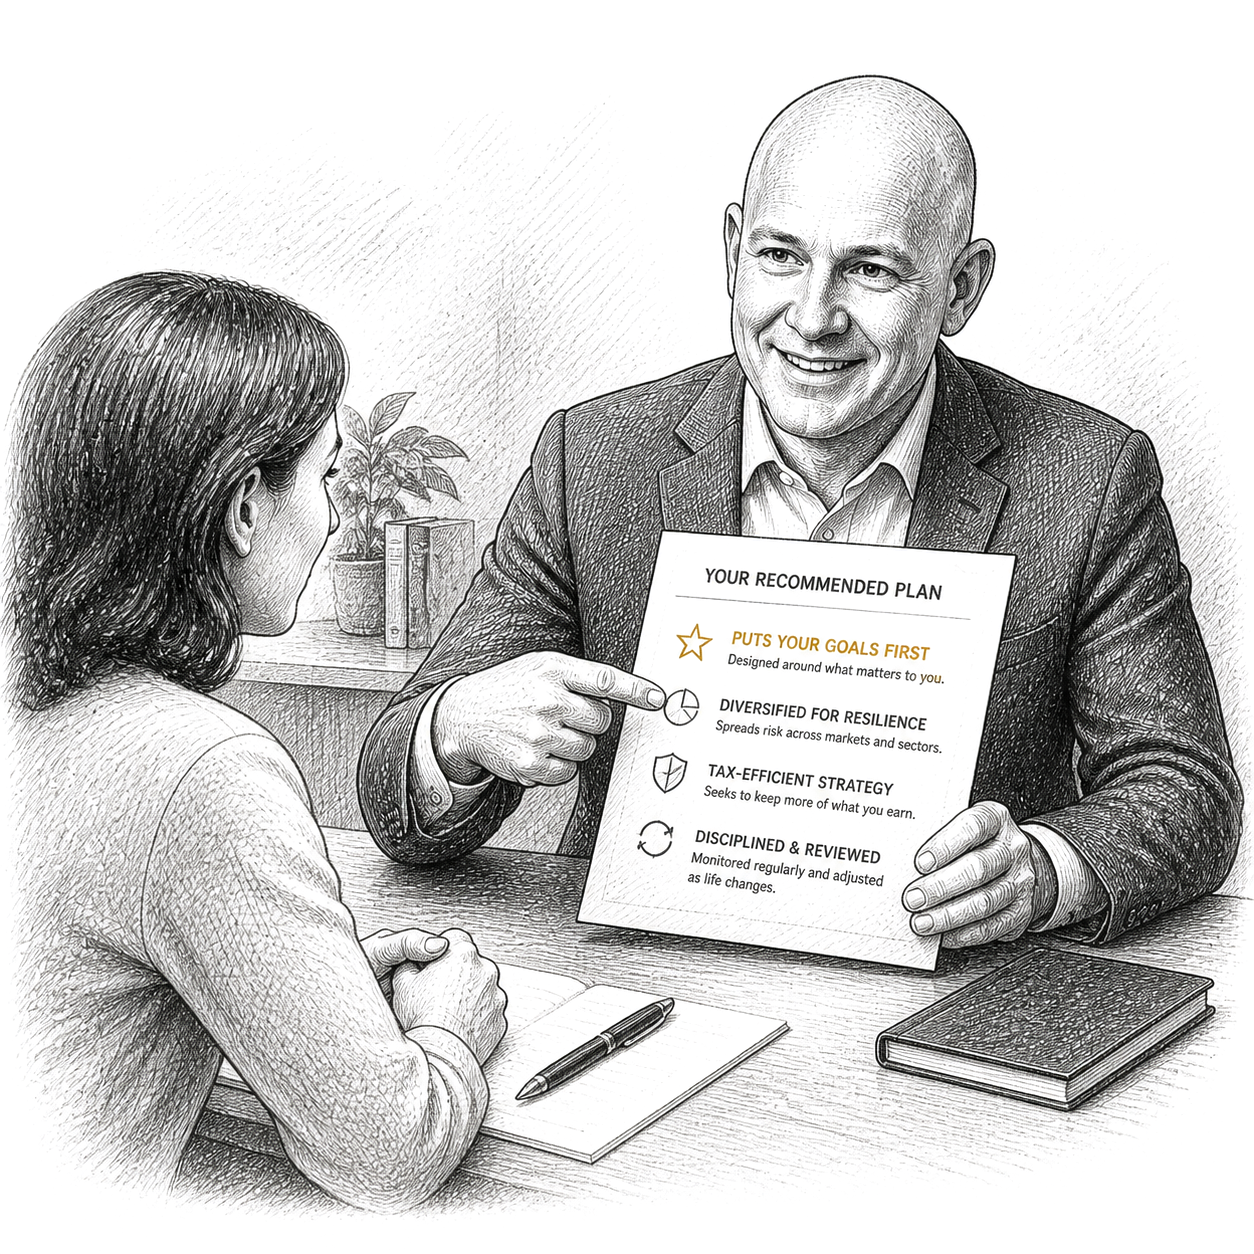
Lead a recommendation with the reason it is good for them. Not the model, not the allocation, not what the research team likes this quarter. 'This shortens the stretch where one bad year would hurt you, because you start drawing in 2029.' The analysis comes after.
Treat fees and conflicts as the floor, not as a disclosure. The corruption result is the closest thing here to a hard rule: nothing above the floor counts while the floor is in question. Say what you are paid, who pays it, and what else you are paid for, before anyone has to ask.
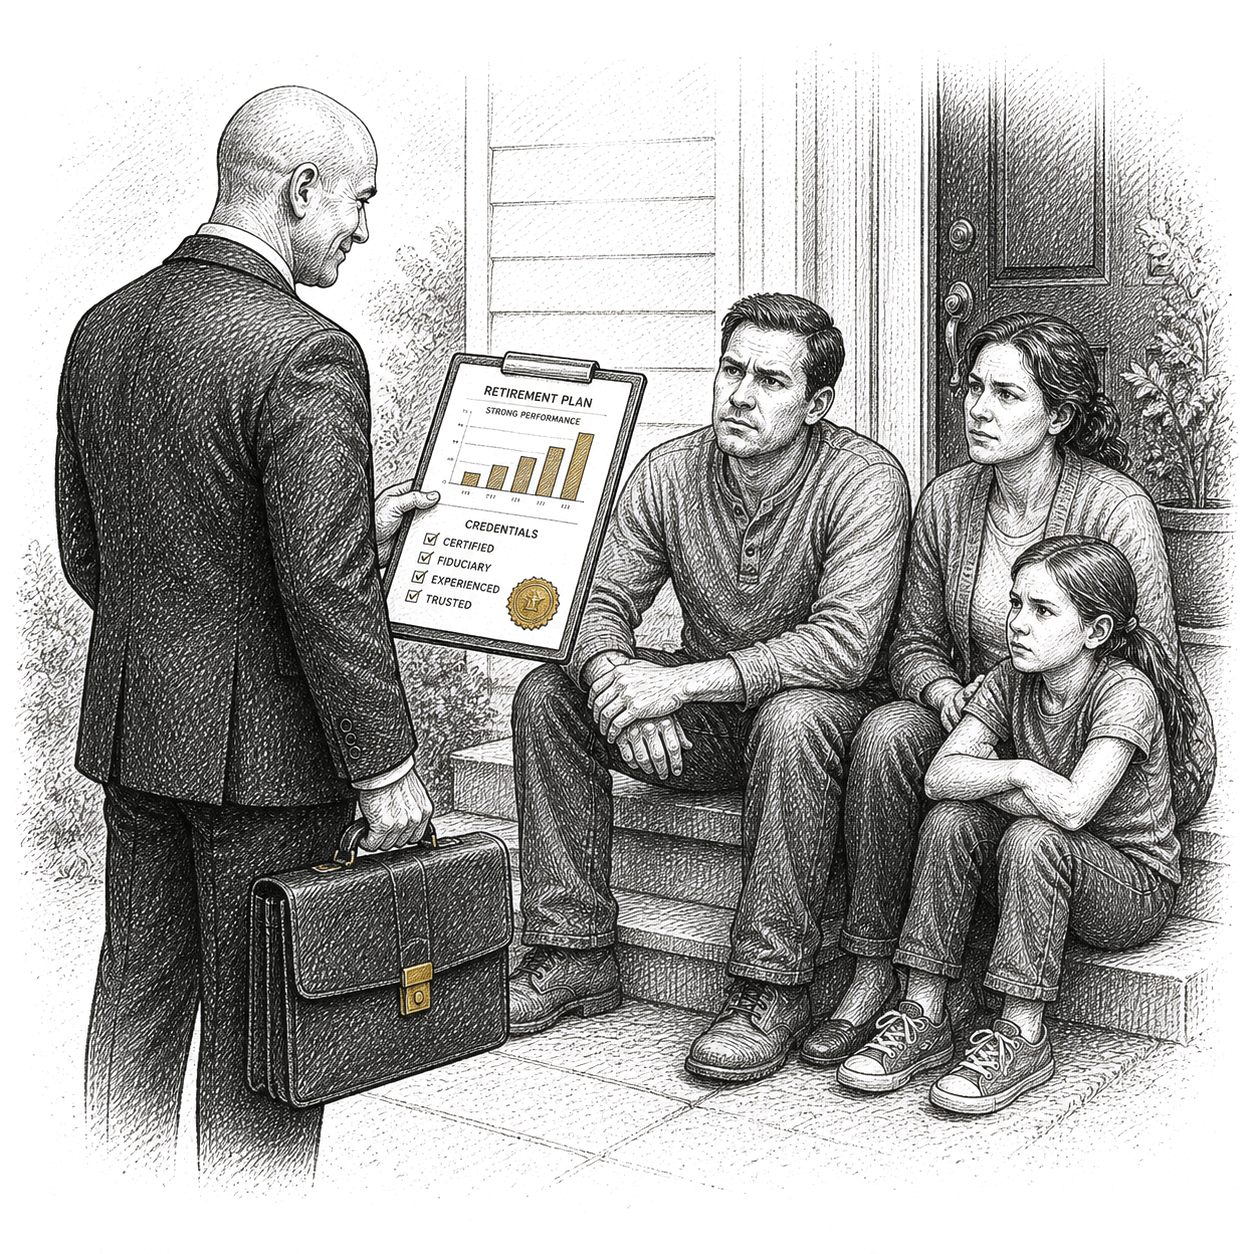
Never let a capability pitch travel alone. A page of credentials with no statement of whose side you are on is the profile these respondents marked down.
The bottom line
Five countries, close to thirty thousand paired comparisons, and the same answer every time. The government that was on their side beat the government that was good at the job, and the one that was good at the job without being on their side did worse for it. Your clients are not rating a government. They are rating how much they trust you.
An Official’s Video Raised Trust in Both Parties
More than eight thousand Americans watched either a car commercial or a short clip of the person who runs their state’s elections. The clip moved Republicans at least as much as Democrats
Gaudette, J., Hill, S. J., Kousser, T., Lockhart, M., & Romero, M. (2025). Can official messaging on trust in elections break through partisan polarization? British Journal of Political Science, 55, Article e16. doi:10.1017/S0007123424000681
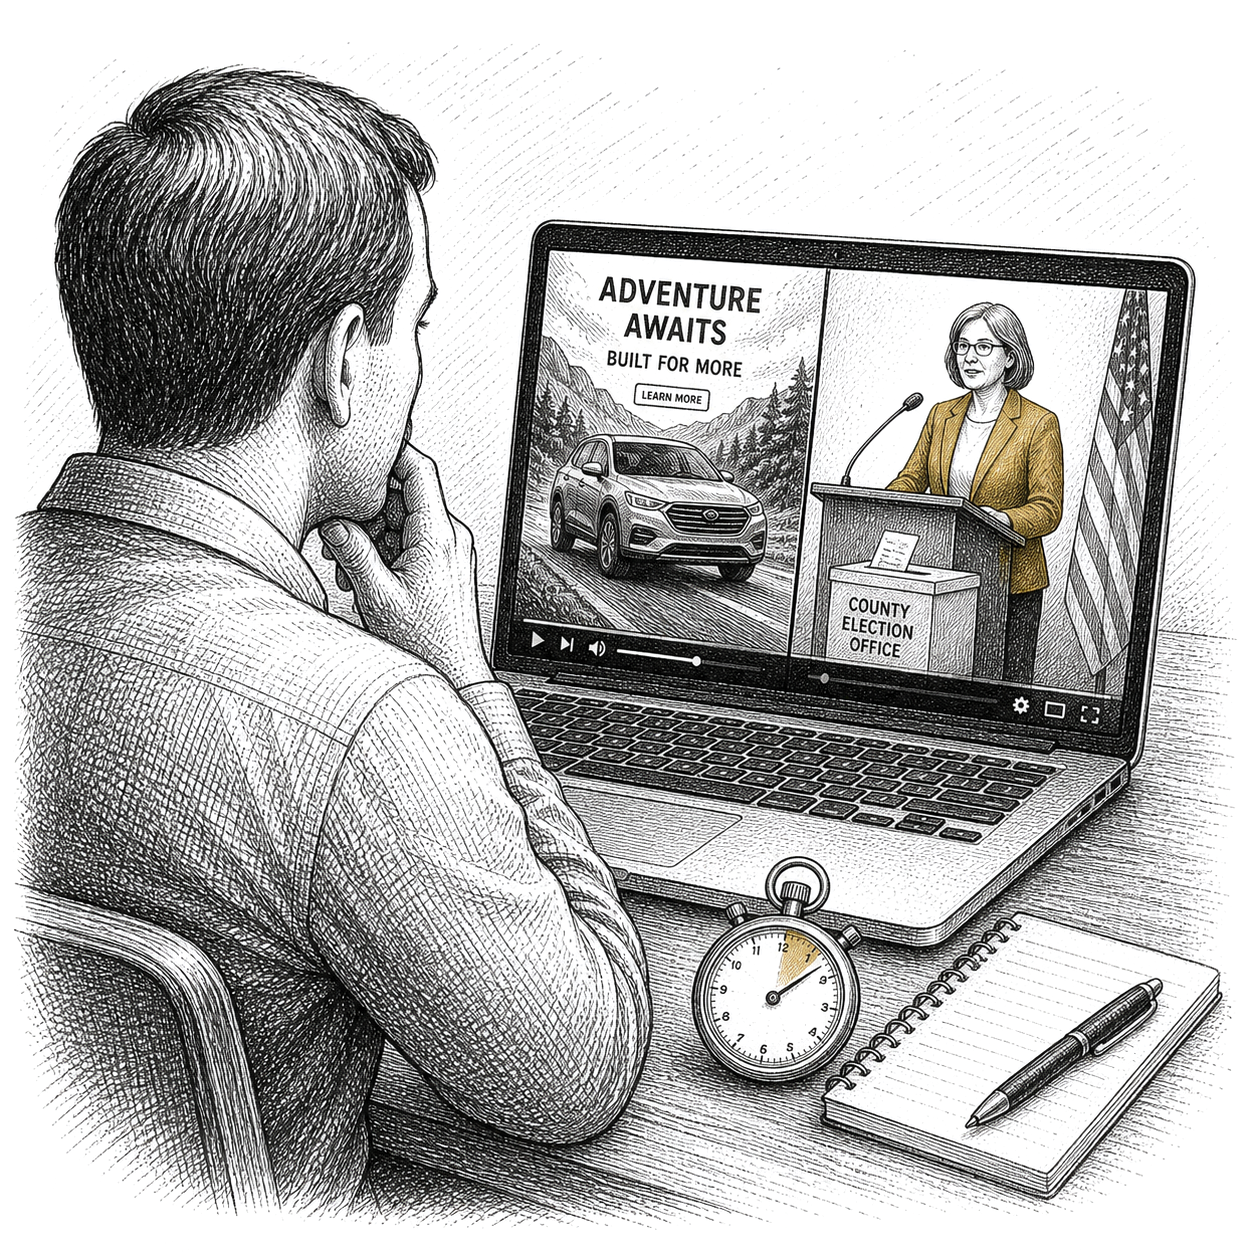
A week after the 2022 midterms, with the House just called and every claim about the count still in the air, more than eight thousand Americans sat down to a survey and watched a thirty-second video.
Some of them got Jake from State Farm. The rest got the person who runs their elections.
The experiment
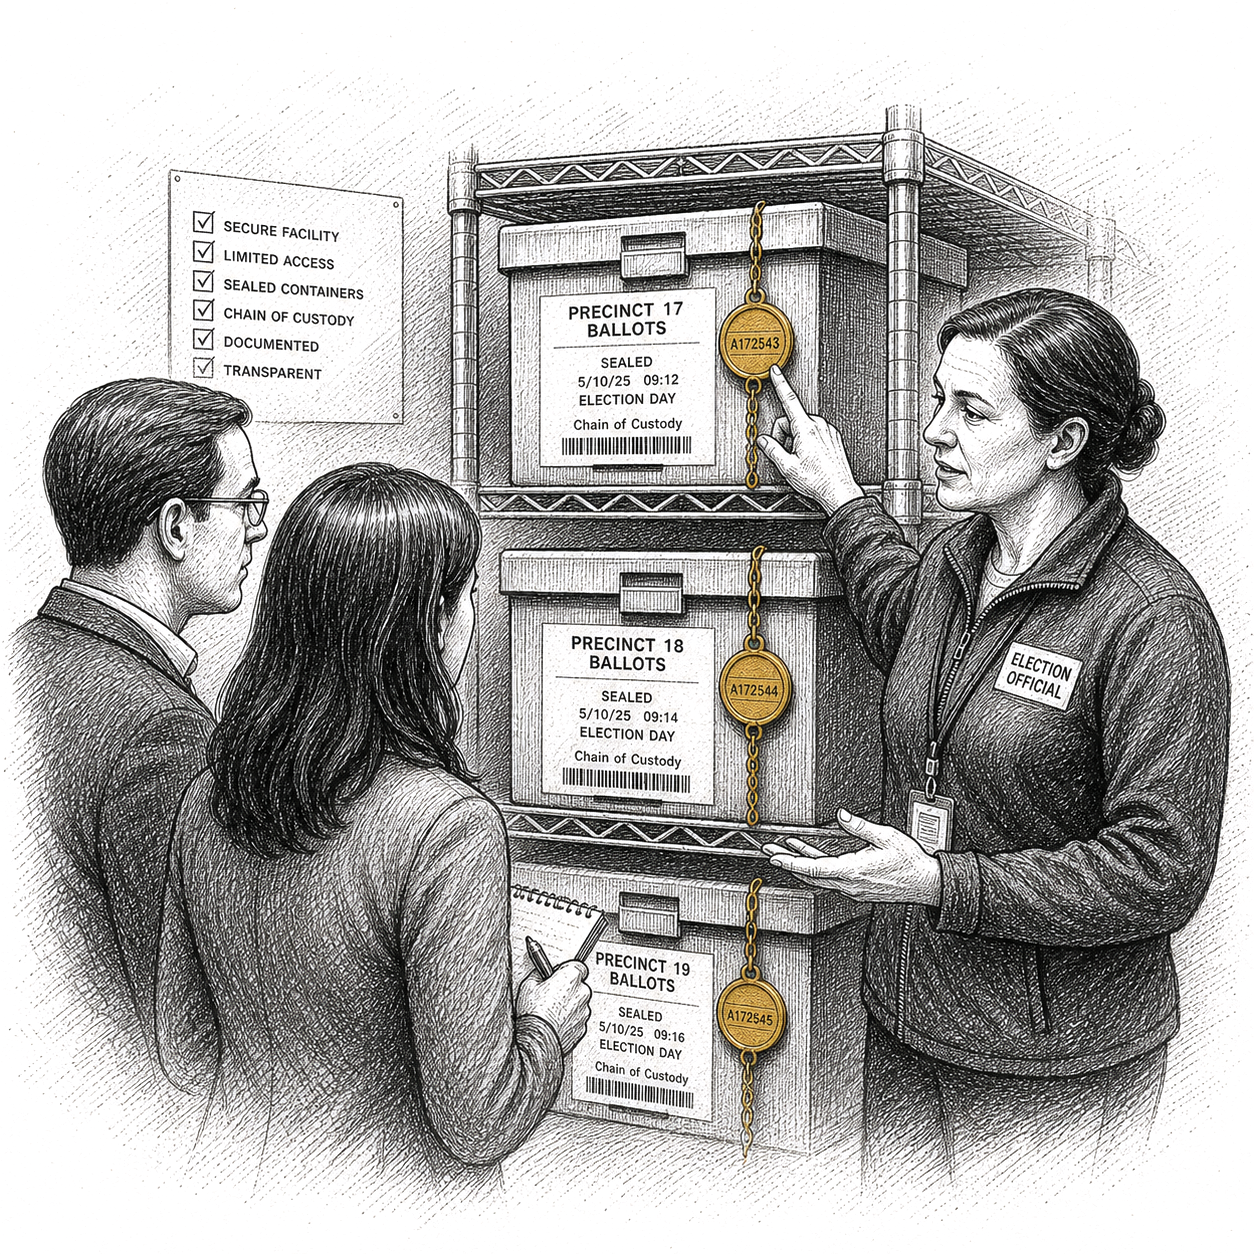
Jennifer Gaudette and four colleagues went to election officials in Los Angeles County, Colorado, Texas and Georgia and asked what they were already doing to rebuild confidence. The officials handed over the videos they had made and helped pick which ones to test. Ten in all. One was a clip of the Texas Secretary of State defending the state’s procedures in a Fox News interview. Others walked through how ballots are secured and counted.
The control group watched an advertisement instead: a thirty-second State Farm spot in the national sample, a thirty-second Cadillac spot in the state and county samples.
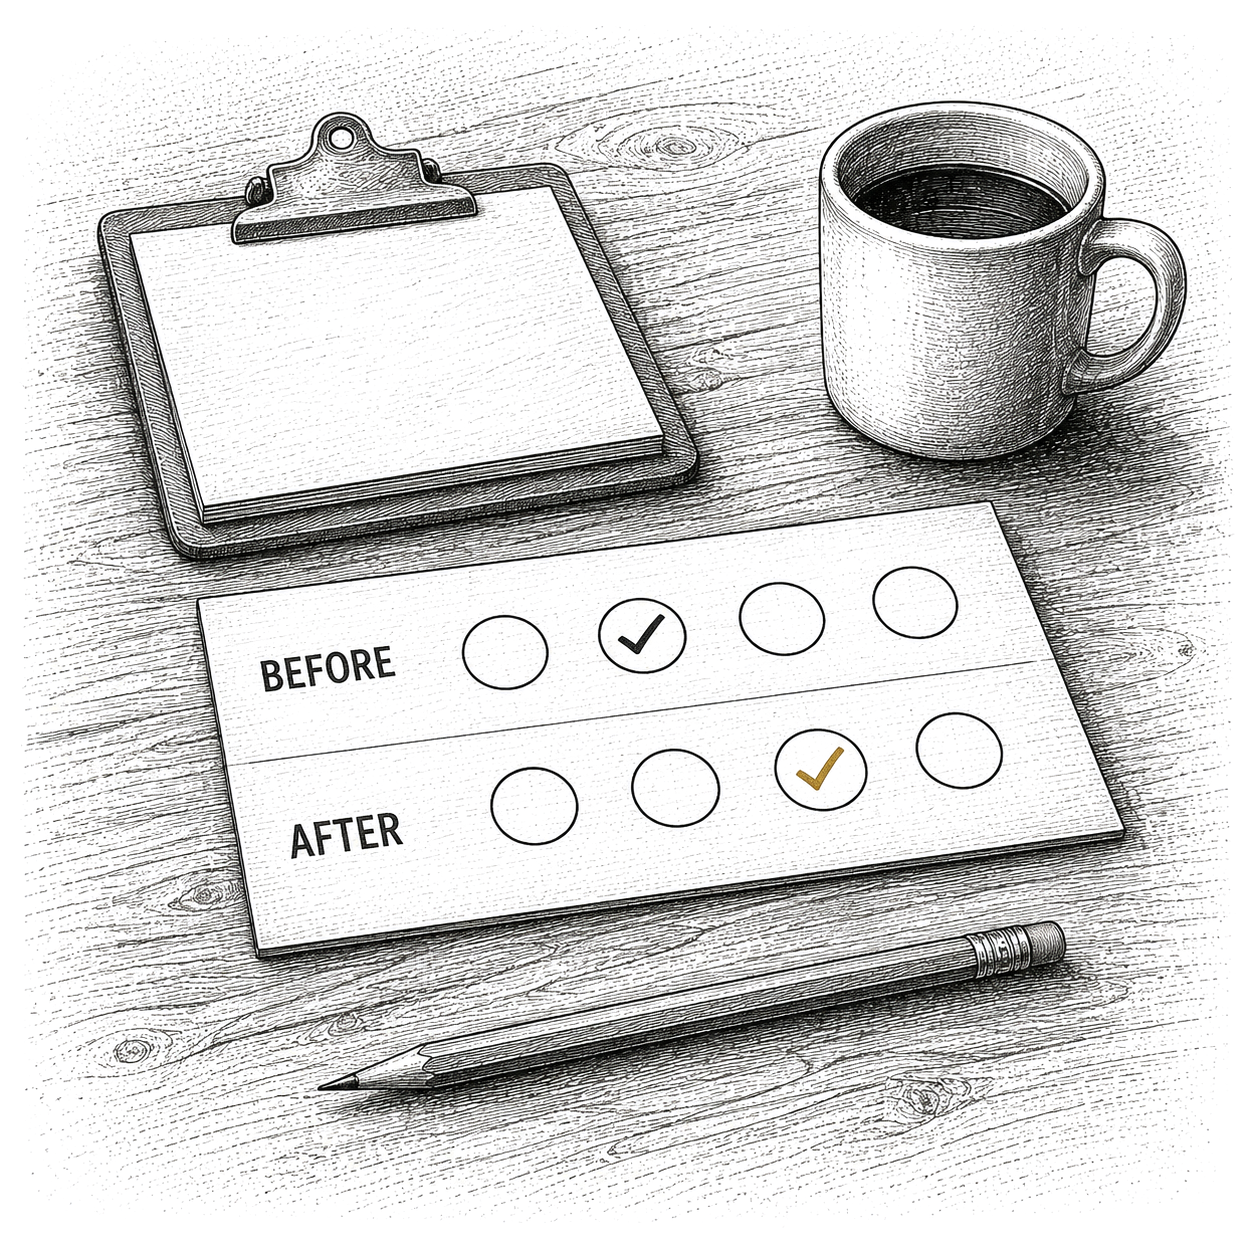
The surveys ran from November 17 to 27, 2022, across five samples. One was a nationally representative panel of 3,038 people. Four were local, roughly 1,500 each, 8,338 people in all. Everyone answered the same trust questions before and after the video, so each person’s shift is measured against their own starting point.
Then a second, independent experiment: a video about elections somewhere else, either Virginia or Maricopa County, Arizona.
What they found
Pooled across the four local samples, watching your own state’s official raised trust in your own state’s elections by 0.12 points on a four-point scale. The smallest local effect was 0.07, in Los Angeles County. The largest was 0.21, in Texas. Counted a different way, Texans who saw an official video were 21 percentage points more likely than Texans who saw the car advertisement to say they trusted their state’s elections some or a lot.
Those 0.12 points are about a fifth of the distance between Democratic and Republican trust in their own state’s elections, measured before anybody watched anything. Thirty seconds of video closed a fifth of the partisan gap.
Beliefs about fraud moved as well. Pooled, the videos shifted the belief that voters commit fraud by 0.066 and the belief that officials commit fraud by 0.083, both toward less fraud.
It worked on the people who trusted least
The question the authors cared about was whether this only worked on people who were already persuaded. It did not. Trust rose among Democrats, Republicans and independents alike. Tested against party identification, the treatment showed no significant difference between partisans.

And it went only where it pointed
The second experiment makes the first one all the more believable. When people watched a video about election protections in Virginia or Maricopa County, their trust in elections in other states rose six times more than their trust in elections in their own. Running it the other way in the first experiment, a video about their own state moved local trust and barely touched their view of anywhere else.
That precision is the tell. Someone who has guessed what a survey is about and wants to be agreeable pushes every trust question upward. These respondents moved the one belief the video they saw had addressed, and left the rest where it was.
One thing did not move at all. Intention to vote in 2024 came in at 0.006, which is nothing. The videos changed what people believed about the count and changed nothing about whether they planned to turn up.
What This Means at Your Desk
Put the person who does the work on camera. The treatment here was not a campaign. It was a county official describing the machine they run. Your operations lead explaining how a trade settles will outperform anything the marketing budget produces.
Explain the procedure, not the result. Voters underestimate the safeguards already in place, which is why a plain description of them moves anyone at all. Your clients underestimate the same category of thing: who holds the assets, who reconciles the statement, what it would take for one person acting alone to move money.
Aim at the worry, not near it. Trust did not travel from one target to another. A firm-wide compliance note does nothing for a client anxious about their own account, and a note about their account does nothing for their doubts about the industry. Answer the question being asked.
Do not expect the behavior to follow the belief. Confidence went up and turnout intent did not. A client can trust you more this quarter and still leave the transfer unsigned. Trust is a precondition, not a trigger.
The bottom line
Thirty seconds of a real official explaining a real procedure moved a contested, politicized belief in the same direction for both parties, at a moment when almost nobody thought anything could. It did that by being specific, and it moved nothing it was not about. That is a low bar and a high standard at once: say the true, dull, particular thing about the thing they are worried about, in your own voice.
The Expert Who Said What to Do Was Rated More Credible
Nearly a thousand Dutch readers got the same facts about garden paving, written two ways. The version that recommended a specific action scored higher, and the gain came from readers deciding the author cared.
van Sebille, E., Weel, C., Vliegenthart, R., & Bos, M. (2026). The effect of advocacy on perceived credibility of climate scientists in a Dutch text on greening of gardens. Geoscience Communication, 9(1), 69-86. Open access: doi:10.5194/gc-9-69-2026

There is a fear that keeps experts quiet, and it is not an unreasonable one. Say what you think should be done and you stop being the person who knows and become the person with an agenda. Safer to lay out the findings and let people decide for themselves.
Erik van Sebille and three colleagues at Utrecht and Wageningen put that fear to the test in front of 996 Dutch adults.
The experiment
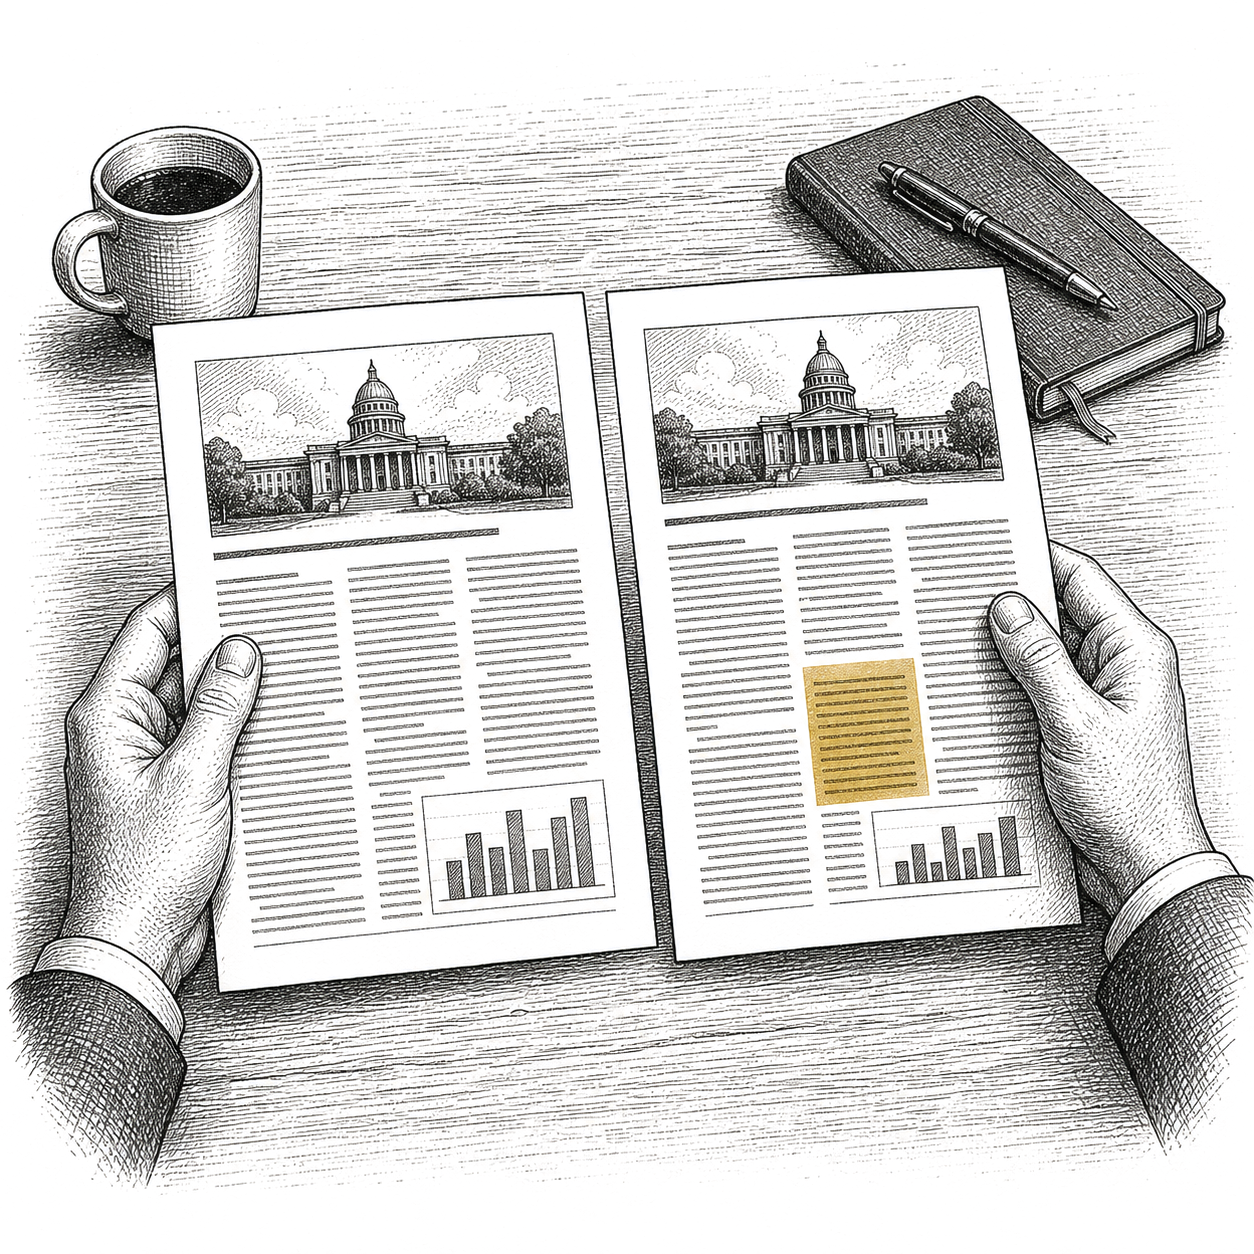
The material was a short article, 425 words, about garden paving. Dutch city gardens average 36 percent vegetation. Tiles hold heat, soil holds rain. Green the gardens across a large city and the air cools by roughly half a degree. A study of one district in Utrecht found that 15 percent more green area meant 24 percent less water draining into the sewer. All of that is real, drawn from an existing website, and all of it shown to all the test subjects.
What differed was whether the author, a fictional professor of ecology and climate, ever said what he thought anyone should do about it.
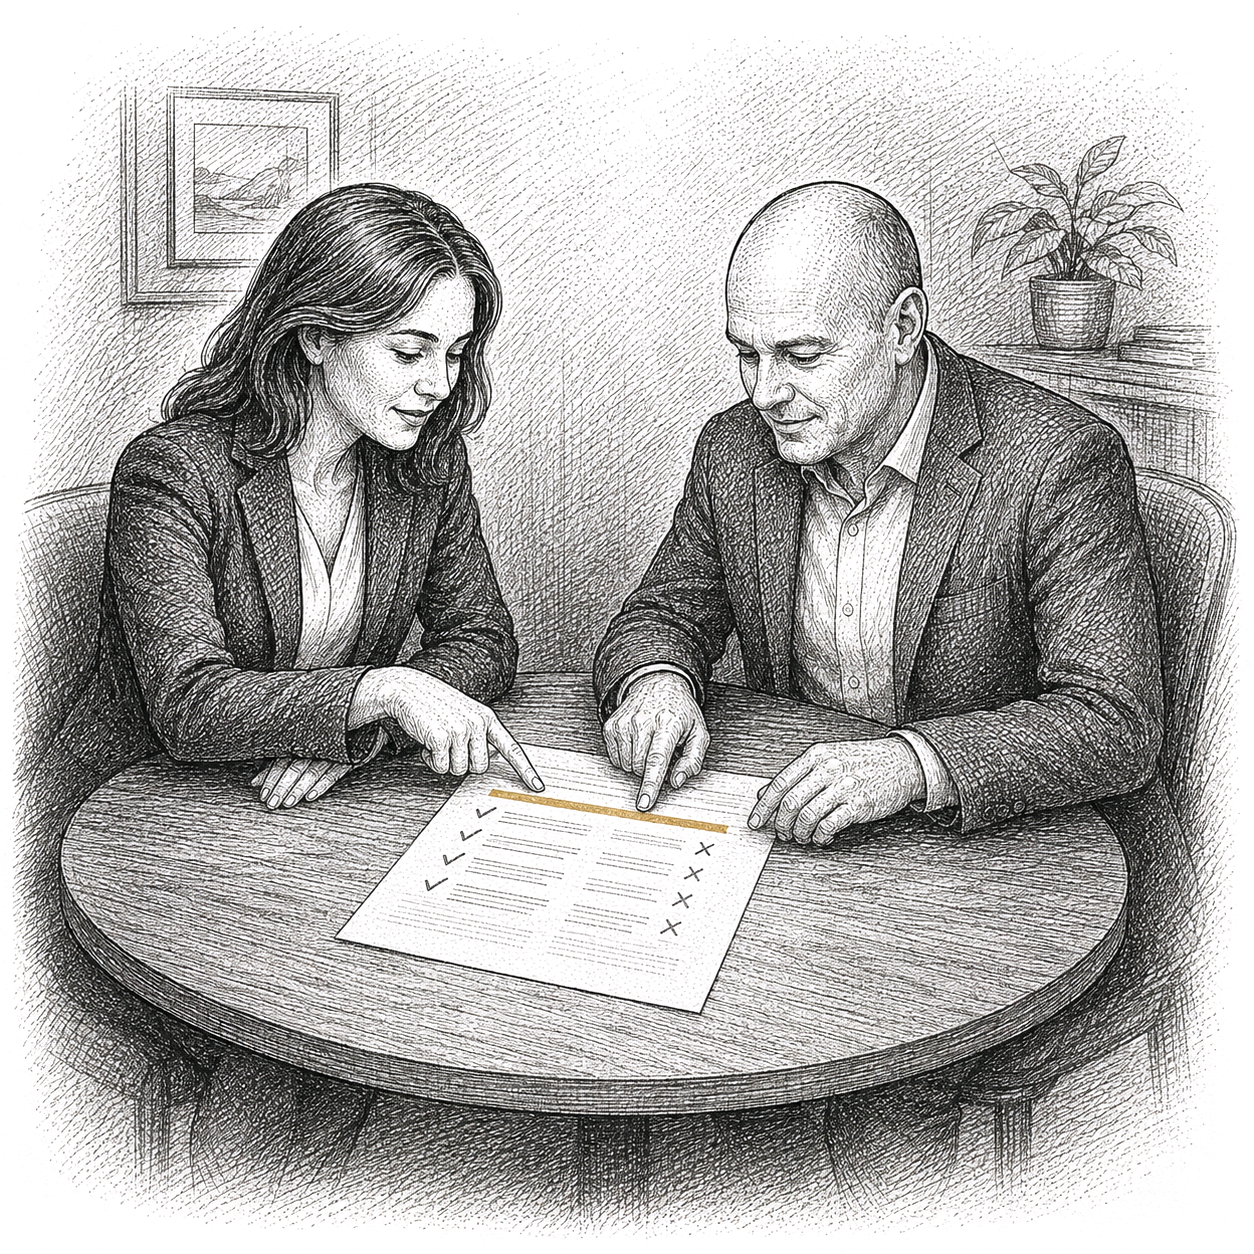
The neutral version stops at the findings, at 331 words. The advocacy version runs to 425. The extra ninety-four words are a person. “I recently removed all the tiles from my garden.” “So my message to everyone is: get rid of those garden tiles.” “As a scientist, I believe that the government should use this knowledge.” And, of a shallow basin dug to hold rainwater: “That is why I also built a wadi myself.”
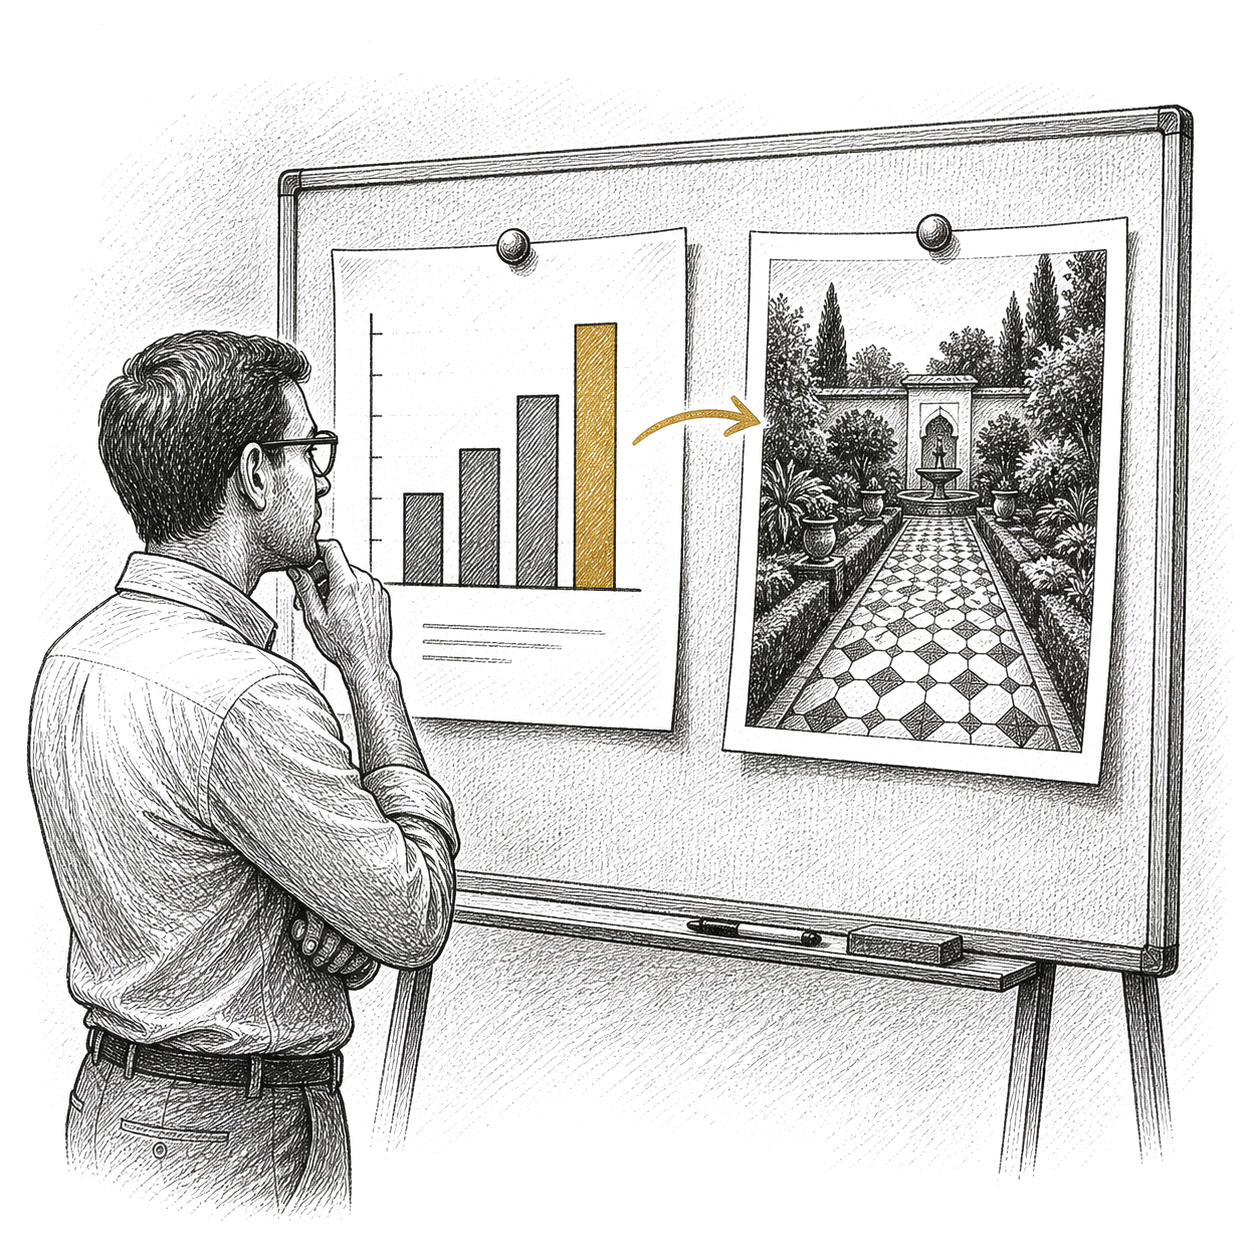
Crossed with that was a second change. Half of each group saw a real bar chart of the temperature effect in five cities. Half saw a stock photograph of a garden. Four groups, roughly 250 people each, drawn from a national survey panel in January 2025.
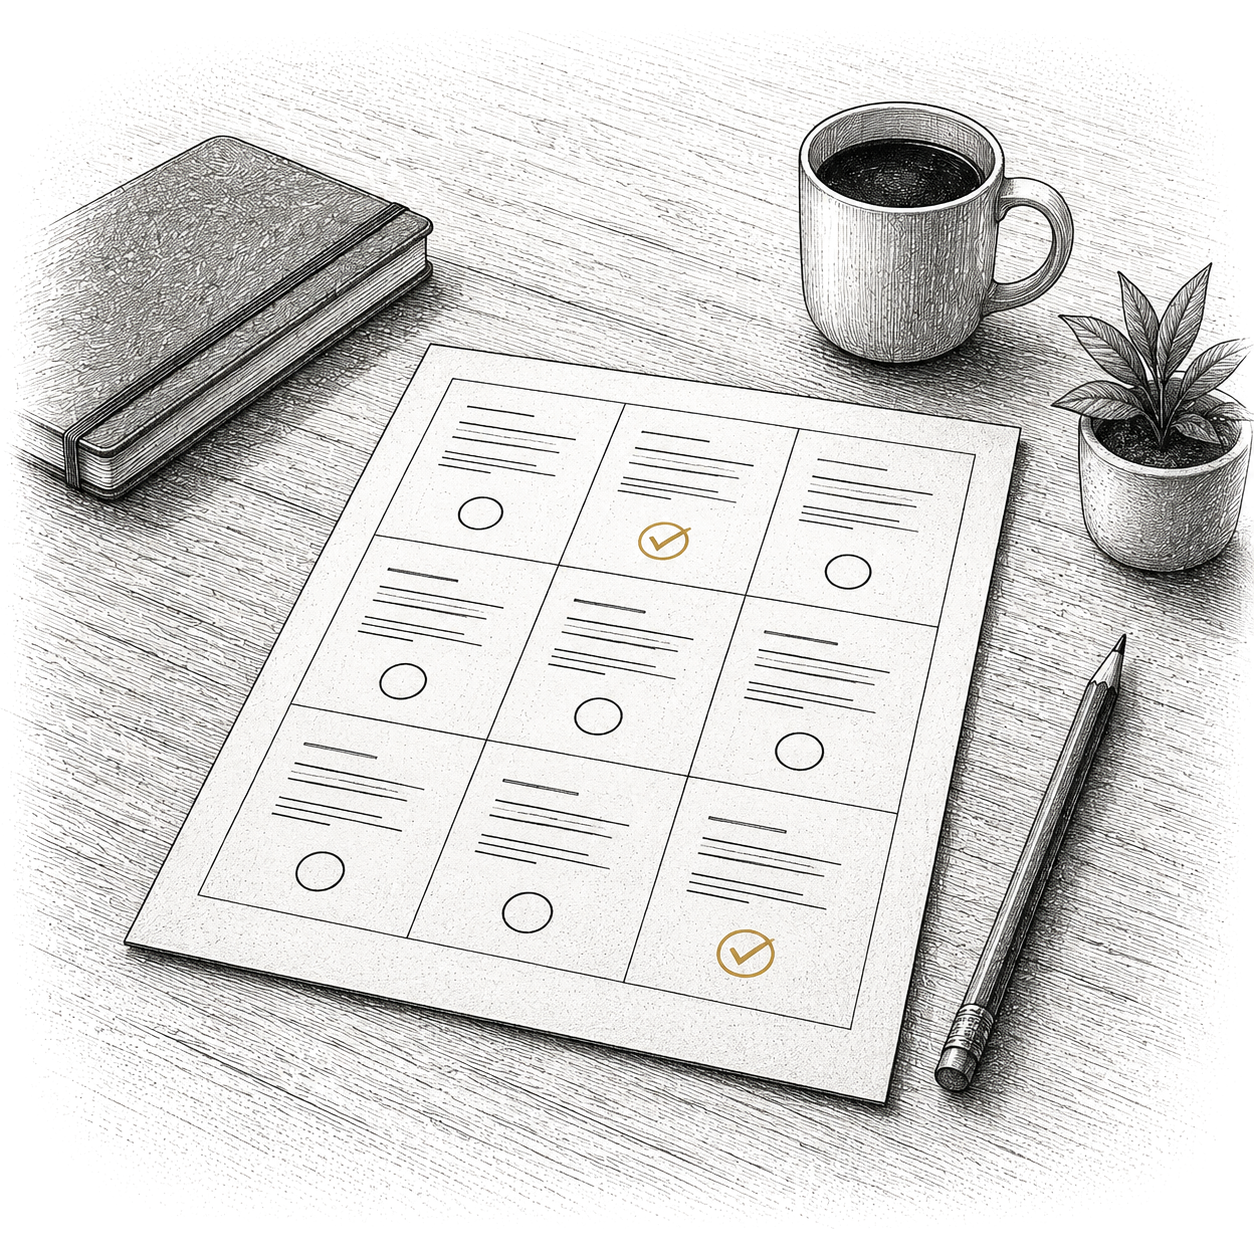
Afterward every reader rated the author on nine statements, each on a seven-point scale. Three covered competence: expert, competent, intelligent. Three covered integrity: trustworthy, honest, sincere. Three covered goodwill: sensitive, concerned about society, cares about society.
What they found
The author did well in every version. Average credibility landed between 5.1 and 5.3 out of seven across the four groups, and fewer than one reader in ten rated him below three.
Sorting readers by which text they got and ignoring the picture, the version that recommended an action scored higher than the neutral one. Sorting them by which picture they got and ignoring the text, the bar chart and the stock photograph were indistinguishable.
The nine statements show where the difference came from. Four of them took a position were trusted, and the largest by a distance was sensitivity.
So the advocate wasn't read as more expert, and he wasn't read as less honest. He was read as more attuned. Saying what should be done was taken as evidence that he had noticed what people were dealing with.
Where it turns around
One important result complicates the advice. The researchers set each reader's credibility rating against how concerned that reader had already been about climate before reading anything. The two ends of that scale tilted apart. Readers who arrived with high concern rated the advocating author above the neutral one. Readers who arrived with low concern rated him below it.
So the recommendation isn't free. It buys goodwill from people who share your reading of the risk and costs goodwill on people who don't.

One more thing. Readers of the advocacy version were no more likely to say they felt called to act. Credibility rose. Behavior sat still.
What This Could Mean at Your Desk
A recommendation reads as care. “Here is what I would do, and why” is not heard as a loss of neutrality. It is heard as evidence you looked at their situation. Presenting four allocations side by side with no view attached is the version that scored lower.
Say what you did yourself. The most personal line in the advocacy text was the professor mentioning that he had already pulled up his own tiles. That is a disclosure of alignment, and it is available to you: what you hold, what you pay in fees, what you told your own family to do about the same question.

Do not spend the budget on the deck. A real chart carrying real data did no better than a stock photograph of a garden. The lever was what the author said, not how the page looked.
Establish the premise before you push the conclusion. With a client who does not share your read on a risk, leading with the recommendation is the move that cost this author credibility. Get to the shared concern first, then say what you would do about it.
The bottom line
The neutral author and the one who said what to do were rated the same on honesty and the same on expertise. The difference was that the second one appeared to care. Neutrality was not protecting his credibility. It was holding back the part of him readers were grading.
The Trust Times is a running collection of independent, peer-reviewed research on how trust is built. Each issue distills a handful of studies into plain language, with a practical note on what it means in practice.